
概要
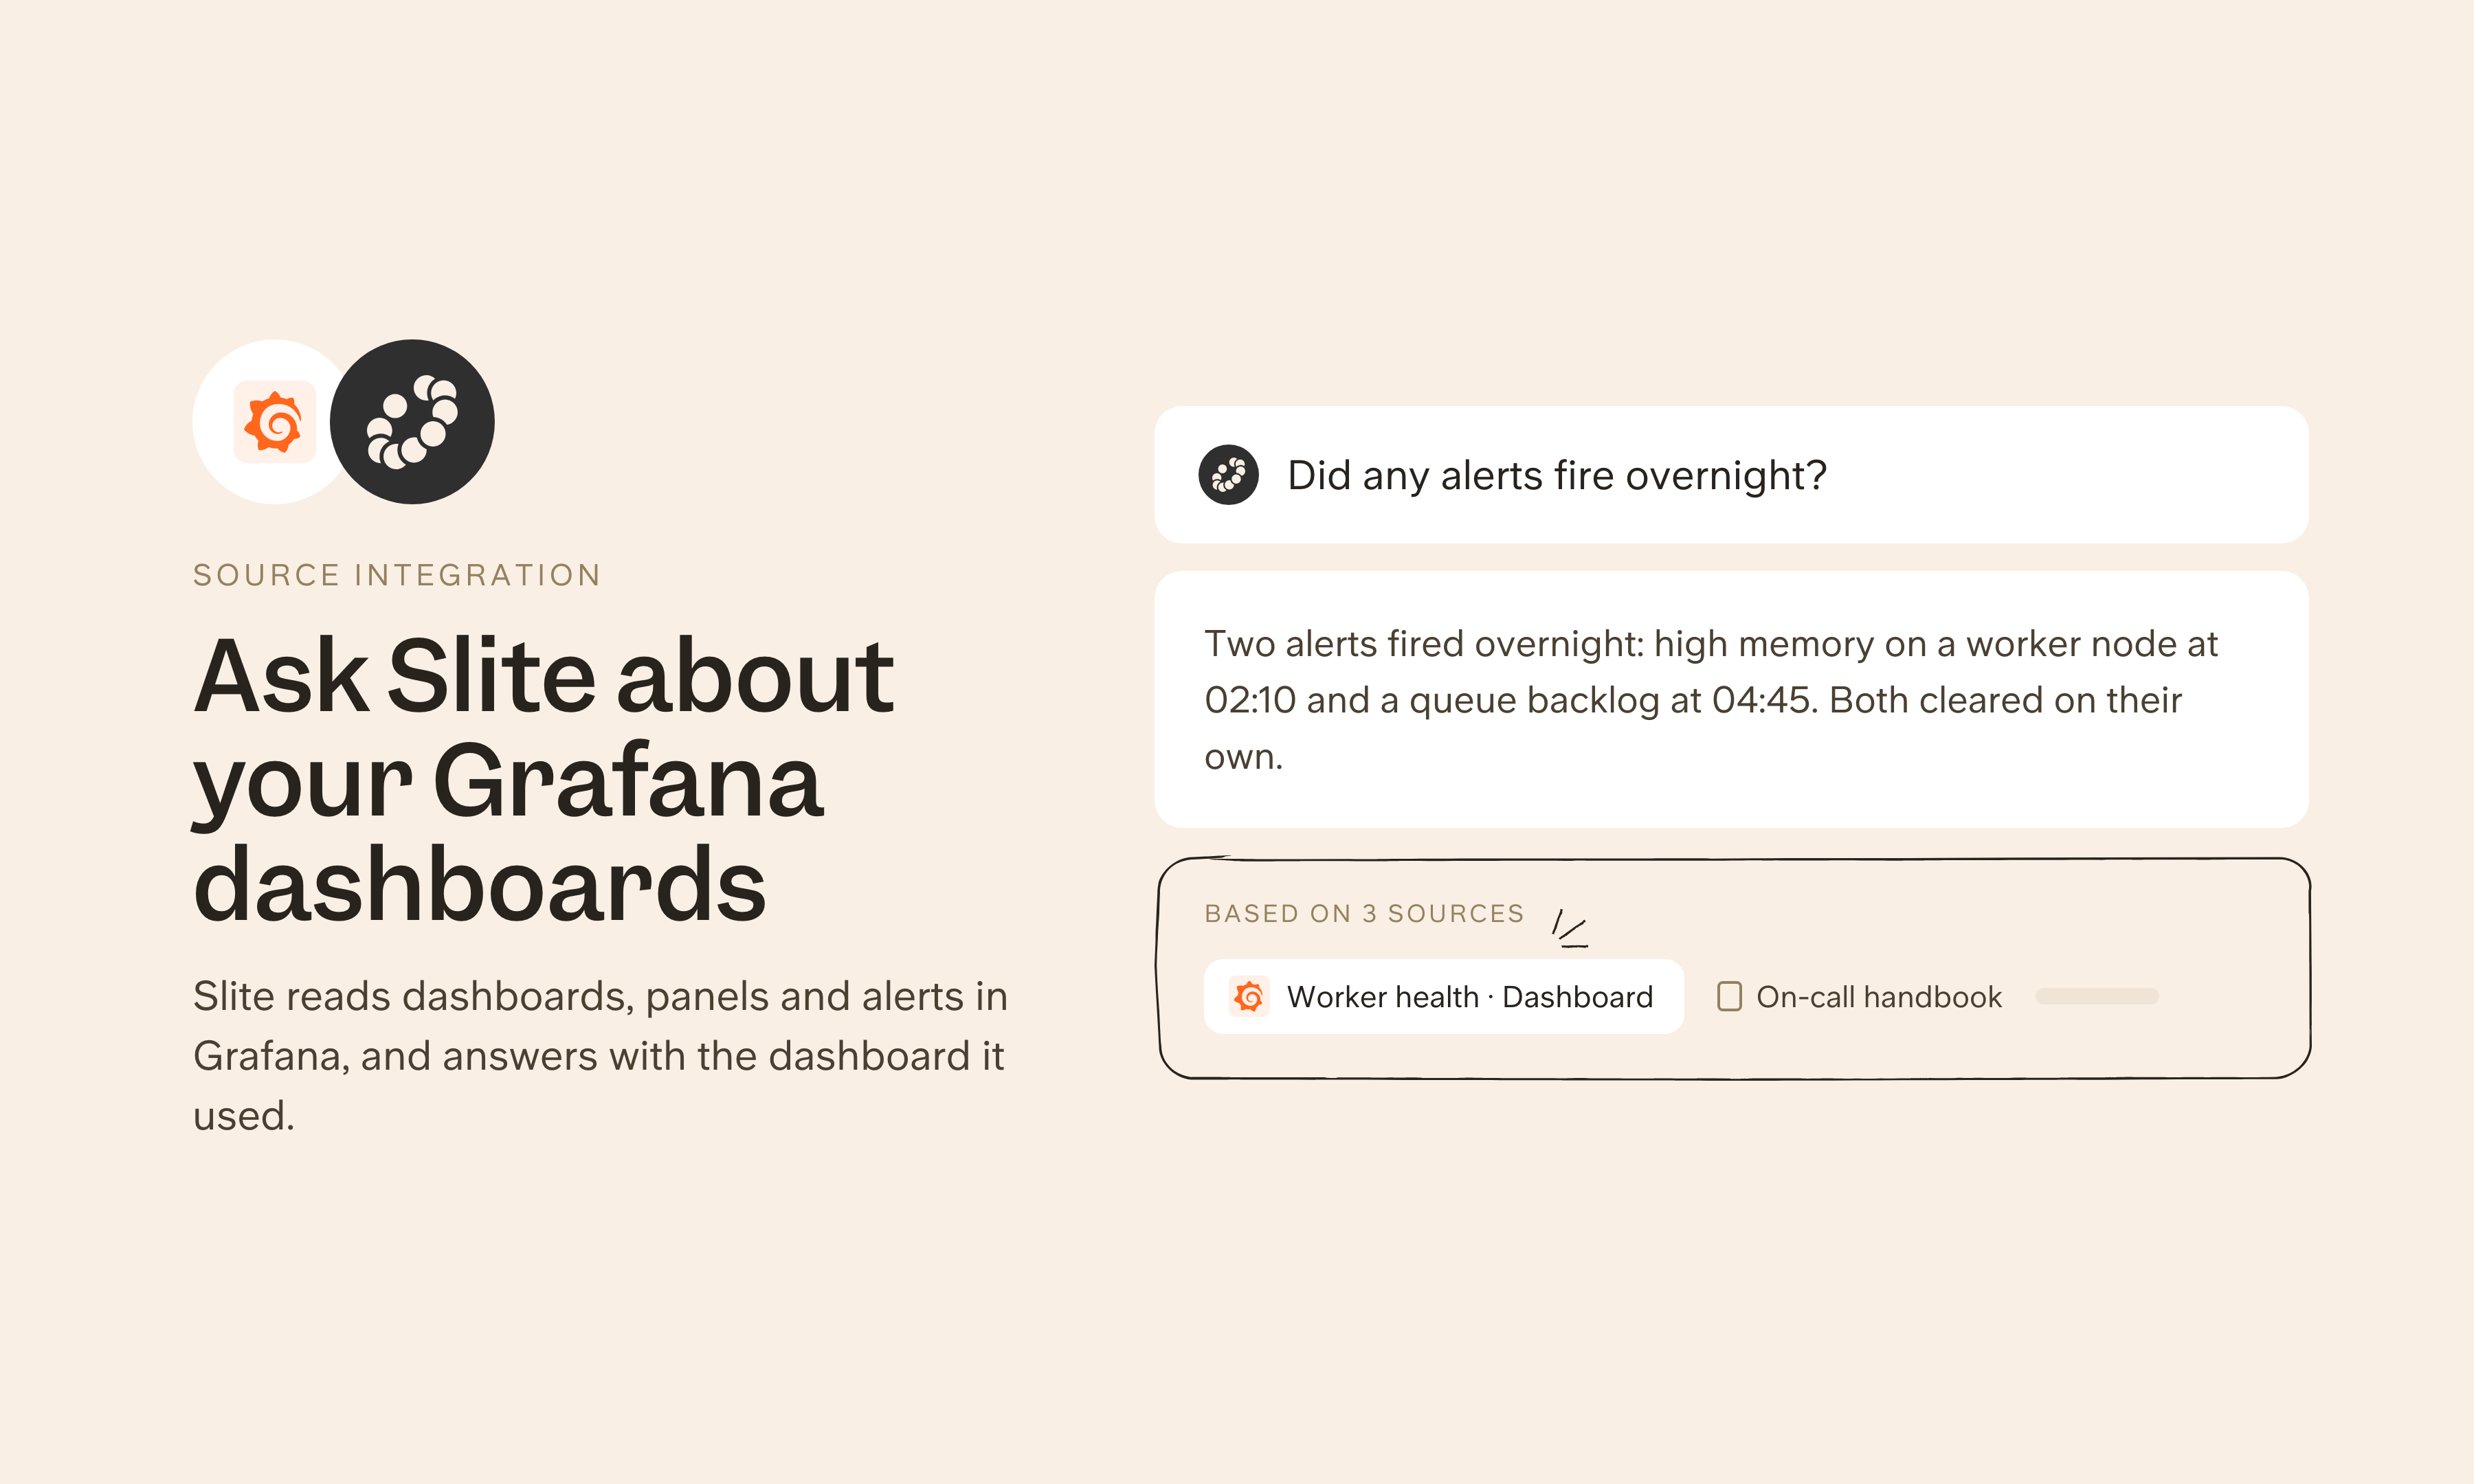
Grafana is the observability platform engineering teams use to chart metrics, logs and traces and get alerted when something breaks. Connect Grafana as a source and Slite can answer questions from your dashboards, alerts, incidents, OnCall schedules, metrics, logs and traces next to your runbooks, so on-call engineers get context during an incident without switching tools.
使い方
Grafana's hosted server works with Grafana Cloud only. In Slite's settings, add Grafana under Agent sources with the server URL https://mcp.grafana.com/mcp and sign in. Slite can then answer from your dashboards, alerts, incidents and logs, following each person's Grafana permissions. An admin can share the connection with the whole workspace, or each person can connect their own account.
Need help setting up your Grafana integration with Slite? contact support .
🔒 We take privacy seriously. Slite is SOC 2 Type II certified, GDPR and HIPAA compliant, with all data encrypted in transit and at rest on EU-based infrastructure. Your data is never used to train, nor retained by, third-party LLMs. See our security page for more information.


